Thursday 15 December 2016

Goodbye

Snapshot corrected moving to unz


It’s goodbye to drjamesthompson.blogspot.co.uk

After 4 years of blogging, and 1,062,720 page views, here is a “change of address” notification. I have decided to transmute into being a columnist, at the kind invitation of Ron Unz, so as to write my psychological comments as a column at:

http://www.unz.com/jthompson

I am happy at the prospect of more visibility, more technical backup, and a more accessible and searchable archive of work. You can search by topic and by date, and I will start adding tags so that all searches become easier and more powerful. I hope to get more readers, given that the site gets 2 million a month, shared between many writers. Whether, in this collective of authors, I will still be able to stare at a page and immediately start writing, without knowing where it is going, as I do now in the apparent wilderness and seclusion of my own blog, is an open question.

Will I experience a crushing writer’s block, the equivalent of entering a sterile business office in order to dream up, to command, a romantic novel, and find that the fluorescent lights and lunchtime canteen deadens my soul? Will I look over my shoulder at what others are writing? Or will I just close my eyes and imagine a single reader in the wilderness, and write for that one person, regardless of all else?

Perhaps I have been over-dramatic, but shifting from my familiar abode causes a certain emotional wrench. It is like walking the empty rooms of a family house while the removal van waits outside. Worse, what if you, dear reader, resolutely refuse to follow me? Will you be set in your ways, a slave to your favourite sites, unwilling to countenance a perturbation in your URLS?

I hope you can shift as I intend to shift, to a new meeting place. The medium is not the message: the medium is what carries the message, and a message only brings you news if the content is hard to guess. We need to talk of many things, of shoes and ships and sealing wax and Shannon’s Mathematical Theory of Communication. I digress, but only a bit.

http://www.unz.com/jthompson

Monday 12 December 2016

Africa and the cold beauty of Maths


Africa TIMMS equipercentile

Things move fast. A published paper comes to the attention of Steve Sailer and suddenly a section of a puzzle gets completed.

http://www.unz.com/isteve/school-test-scores-in-africa/

Better still, the boundaries of ignorance get pushed backwards, which is always a good idea, and a fine Christmas present.

From the isolation of my study, and from the depths of my ignorance, I had always bemoaned the fact that poorer countries, particularly in Africa, avoided taking part in PISA and similar international assessments. The suspicion was that they were avoiding getting bad results, which would redound on their national pride, showing them to be dull and/or incapable of organising their schools properly. PISA has the capacity to spread embarrassment far and wide, in rich as well as poor countries, and I am all in favour of that. Let the over-paid educational authorities of the rich world be confounded by the wit of poorer nations, and may their cosy empires fall. Also, may badly organized countries stop blaming poverty and make sure they pay and support their teachers.

The problem with the lack of participation of these countries was that researchers lost a possible confirmation or disconfirmation of the IQ results obtained on those countries, which in the case of Africa seem to be too low to be believed. How to sort out this problem?

Justin Sandefur, Working Paper 444, December 2016, Center for Global Development.

Internationally Comparable Mathematics Scores for Fourteen African Countries

Abstract

Internationally comparable test scores play a central role in both research and policy debates on education. However, the main international testing regimes, such as PISA, TIMSS, or PIRLS, include very few low-income countries. For instance, most countries in Southern and Eastern Africa have opted instead for a regional assessment known as SACMEQ. This paper exploits an overlap between the SACMEQ and TIMSS tests—in both country coverage, and questions asked— to assesses the feasibility of constructing global learning metrics by equating regional and international scales. I compare three different equating methods and find that learning levels in this sample of African countries are consistently (a) low in absolute terms, with average pupils scoring below the fifth percentile for most developed economies; (b) significantly lower than predicted by African per capita GDP levels; and (c) converging slowly, if at all, to the rest of the world during the 2000s. While these broad patterns are robust, average performance in individual countries is quite sensitive to the method chosen to link scores. Creating test scores which are truly internationally comparable would be a global public good, requiring more concerted effort at the design stage.

http://www.cgdev.org/sites/default/files/math-scores-fourteen-african-countries0.pdf

This fine paper comes from the economic sphere of study, so does not reference much psychometric literature. A pity, because it contributes much to the debate on group differences. Economists often ignore the concept of intelligence. Sandefur also seems to accept African national economic statistics, though he probably realizes they are prone to wishful thinking.  The author is circumspect about the key issue of comparability of difficulty levels across tests, but seems to have made reasonable choices. I doubt that a re-working would change the picture very much.

The linkage is made possible by Botswana and South Africa having taken both the regional SACMEQ and the TIMSS international tests; and the 2000 and 2007 regional tests having used some of the TIMSS international test questions.

Whatever the linkage methods, the results are pretty grim:

Substantively, the results here are daunting for African education systems. Most of the national test-score averages I estimate for the thirteen African countries in my sample fall more than two standard deviations below the TIMSS average, which places them below the 5th percentile in most European, North American, and East Asian countries. In contrast, scores from the SACMEQ test administered to math teachers are much higher, but fall only modestly above the TIMSS sample average for seventh- and eighth-grade pupils, in line with earlier analysis by Spaull and van der Berg (2013). African test scores appear low relative to national GDP levels; in a regression of average scores on per capita GDP in PPP terms, average scores in the SACMEQ sample are significantly below the predicted value using all three linking methodologies. Furthermore, there is little sign that African scores were improving rapidly or converging to OECD levels during the 2000s.

Of course, readers of this blog will know that Richard Lynn’s personal collection of international intelligence test results, now in the Becker edition, puts Sub Saharan intelligence two standard deviations below the European mean, so it closely matches these results.

https://drjamesthompson.blogspot.co.uk/2016/10/richard-lynn-intelligence-database.html

The advantage of using Maths tests as a proxy for intelligence tests is that most intelligence tests have an Arithmetic subtest and/or number series tests, so one can follow some known correlations to estimate comparability's. Better still, Maths has a logic to it, so it is valid to talk about some operations being more complex than others. The same item is very much the same item whichever test you find it in, because the same steps are required to solve it. It has the cold beauty of which Bertrand Russell spoke:

“Mathematics, rightly viewed, possesses not only truth, but supreme beauty — a beauty cold and austere, like that of sculpture, without appeal to any part of our weaker nature, without the gorgeous trappings of painting or music, yet sublimely pure, and capable of a stern perfection such as only the greatest art can show. The true spirit of delight, the exaltation, the sense of being more than Man, which is the touchstone of the highest excellence, is to be found in mathematics as surely as poetry”.

More prosaically, maths opens the door to many other intellectual tasks, much as literacy supersedes the oral tradition.

What is to be done with African Maths teachers? Heiner Rindermann, trying to resolve the debate between Richard Lynn and Jelte Wicherts, put Sub-Saharan African IQ at 76. As to African Maths teachers’ results in this paper, he says: In some African countries teachers seem to have lower abilities than students in Europe or East-Asia!

If teachers are one standard deviation above the national mean, then they would have IQs of 91, if two standard deviations above the mean still only 106. This is not a level likely to inculcate in their students a passion for Maths, a subject which every schoolchild recognizes as being different conceptually from other language based subjects, and hard to master. What makes problems difficult? I digress. 

Convergence is a much desired trajectory where racial differences are concerned. Put in the educational resources and the slower countries will catch up with the faster ones. Makes sense. However, this sought-after outcome does not always materialize. Convergence will take place sometime between 40 years and never, according to Woodley and Meisenberg.

https://drjamesthompson.blogspot.co.uk/2013/08/original-paper-are-cognitive.html

Turning to the pressing issue of how to raise scholastic attainments, it is unlikely to be a simple question of investing money. Saudi Arabia has had plenty of money to spend on education for almost 50 years, and just look where it languishes in the table, in the company of far less wealthy Swaziland, Tanzania, Botswana and Uganda. Of course, given Saudi Arabia’s mean IQ of 78 that would be entirely as expected. No Africanist, I have nonetheless sung the praises of Botswana, a well run country which invests heavily in education (the Diamond Generation). Despite that, Botswana is not getting much bang for its buck. If Botswana cannot converge on other nations, despite having done so many things right, that should give pause for thought. Botswana’s mean IQ 73.

https://drjamesthompson.blogspot.co.uk/2013/12/the-wages-of-mandela.html

A summary of investment in education suggests that the pay-off is front-end loaded: the first $5000 has a big effect, and then it tends to plateau thereafter. Another way of looking at it is to note that once countries get to $16,000 GDP per capita then schooling in those countries accounts for only 10% of the variance of student attainment. So, poor countries (most of Africa is well below this level) should have plenty of scope for educational gains.

This paper completes a jigsaw puzzle, and extends the global scholastic attainment dataset by 14 countries. It confirms the Lynn assessments as likely to be correct, within a measurement error of roughly 4 IQ points. For these countries at least, it gives no hint of exceptional talents beyond that expected on the basis of intelligence testing.

I don’t do policy, so this is said more in hope than with any expectation of a good result, but if young Europeans school-leavers with good maths qualifications intending to do good works in Africa want to be most effective, instead of digging ditches they should concentrate on teaching Maths.

Thursday 8 December 2016

Der tag


Daily total 5018

Thank you to the 5018 readers who looked in on “Psychological Comments” yesterday.

Why?

Not complaining, just curious.

For the previous highest daily total see:  

https://drjamesthompson.blogspot.co.uk/2015/04/der-tag.html

Wednesday 7 December 2016

Faking good on PISA


Faking good on PISA


One of the delights of being a member of a community of researchers in the modern age is the speed with which colleagues can come together to answer a question and scope out a solution to a problem.

Steve Sailer has looked at the most recent PISA results, which he has been discussing generically for many years. 

http://www.unz.com/isteve/new-pisa-test-results/

He pointed out that in some countries a large proportion of eligible children don’t show up in the statistics. Could it possibly be the case that they are discretely told to stay at home, because national pride is at stake? Perish the thought! He pointed out that Argentina had apparently made stellar gains, but a commentator on his blog pointed out later that there was so much cheating in the Argentine provinces that the results had to be discarded, and the declared results are for Buenos Aires only, so probably higher than the national figures, or so the porteños would have you believe. Incidentally, it is only recently that Argentina has had economic data, such as for inflation, that could be vaguely trusted, so they are only just in the Truth Recovery phase.

Cheating is the easiest way to boost results. Teachers can look at the questions some days before the test, and do a crash course in “revision” for the class. This makes teachers, children, parents and governments happy. PISA says it has methods to ensure security and detect cheating, but Heiner Rindermann also has his own ability to look carefully at PISA’s published results, and rejects some of them on the grounds of improbability.

Anatoly Karlin also had a look at the dataset and discussed the disappointing performance of China and other eastern countries, with Russia doing better. Get his full account here:

http://www.unz.com/akarlin/pisa-2015/

I wondered how big the effect of such selective non-attendance on the examinations might be. There is also the confounder that age at ending secondary education varies between one country and another, so that must be factored into the equation.

Emil Kirkegaard suggested an approach, and after discussions with me and Gerhard Meisenberg, sorted it out quickly. Have a look at the full process here:

http://rpubs.com/EmilOWK/233323

Emil had also asked Heiner Rindermann to comment, and he came in a few minutes later, with a detailed publication (not yet published, so I cannot show it to you) and a rule of thumb adjustment you can apply to all the countries.

Heiner says:

School attendance rate of 15 year old youth (usually, but not always,  given in PISA reports, usually somewhere at the end).
Do not confuse with participation rate in PISA study.

Per each percent point not attending school subtract 1.5 SASQ points (equivalent 0.225 IQ points). That is a rule of thumb.


I have made a smaller correction for countries at low ability levels - in such countries pupils in school do not learn much.

Not bad for a few hours of internet time.

A few hours later, Steve Sailer had further and better particulars on the results:

http://www.unz.com/isteve/2015-pisa-mean-scores-in-perspective/

So, where does this leave us with the PISA results? First, it gives me a chance to quote myself, one of the consolations of a lonely blogger: “Nobody gets round sampling theory, not even the Spanish Inquisition.” 

Second, and arising from the quote, the consequence is that the PISA results are only generalizable if the sample is a fair selection of the relevant group. In my view, to understand the abilities of a nation, the relevant group should be the entire age cohort. If many 15 year olds have already left school then a school sample will always be a partial indicator of a nation, and will very probably flatter it. This is because weaker students find school frustrating and leave, whereas the brighter ones enjoy studying, understand its long term benefits, and stay in education as long as they can. Further, if teachers ensure that even among those still staying at school the weaker students fall discretely ill on the day of testing, then the results can be massaged upwards. Spotting weaker students is easy for teachers: they can quickly determine it from student questions, and more accurately determine it by marking their class test papers.

Third, I do not want to reject PISA results, because local examination results share many of the same problems. In any nation where some teenagers leave school early the local examination results will be better than the actual national average. Equally, if within a school cohort not everyone takes the same national examination, the same flattering distortion takes place.

Fourth and finally, I think it best to study PISA results once they have been corrected to account for incomplete age cohorts in the Rindermann fashion, or in some elaboration and refinement of that technique.  Absent that, they have a large error term and present too rosy a picture of national scholastic attainments.

Thursday 1 December 2016

Does Age make us sage or sag?


If you are of sensitive disposition, and certainly if you are over 60 years of age, look away now. Age is not good news for the thinking person. The results can be summarised in one word: decline. If you protest that I have been too brief, I can triple the word count: decline and fall.

Can we find more appealing results by taking another large sample, and applying more extensive measures of mental ability?

Elise Whitley, Ian J. Deary, Stuart J.Ritchie, G. David Batty, Meena Kumari, Michaela Benzeval. Variations in cognitive abilities across the life course: Cross-sectional evidence from Understanding Society: The UK Household Longitudinal

https://drive.google.com/file/d/0B3c4TxciNeJZSWNNczFpclo4UWs/view?usp=sharing

Background: Populations worldwide are aging. Cognitive decline is an important precursor of dementia, illness and death and, even within the normal range, is associated with poorer performance on everyday tasks. However, the impact of age on cognitive function does not always receive the attention it deserves.

Methods:

We have explored cross-sectional associations of age with five cognitive tests (word recall, verbal fluency, subtraction, number sequence, and numerical problem solving) in a large representative sample of over 40,000 men and women aged 16 to 100 living in the UK.

Results:

Women performed better on word recall tests and men had higher scores for subtraction, number sequence and numerical problem solving. However, age-cognition associations were generally similar in both genders. Mean word recall and number sequence scores decreased from early adulthood with steeper declines from the mid-60s onwards Verbal fluency, subtraction and numerical problem solving scores remained stable or increased from early to mid-adulthood, followed by approximately linear declines from around age 60. Performance on all tests was progressively lower in respondents with increasingly worse self-rated health and memory. Age-related declines in word recall, verbal fluency and number sequence started earlier in those with the worst self-rated health. There was no compelling evidence for age dedifferentiation (that the general factor of cognitive ability changes in strength with age).

Conclusions:

We have confirmed previously observed patterns of cognitive aging

Age and ability


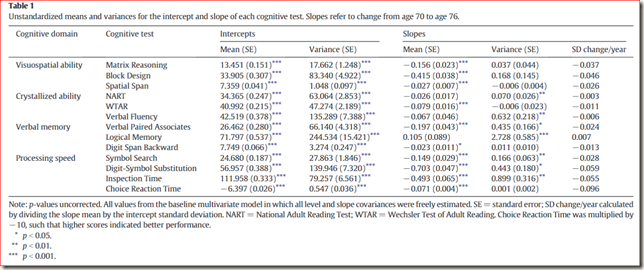
Sharp declines for word recall, verbal fluency and number sequences; declines after 60 years of age for numerical problem solving, and even some gradual decline on subtraction. Ironic, is it not, that after the subtraction of all our skills, subtraction itself should be spared?

Somewhat chastened by these findings, I turned to another paper in the hope it would cheer me up. Written by the same incredible Edinburgh gang, who have cornered the market in ageing research, they try to find what makes people age well from a cognitive point of view. Surely with a few mental exercises and a good helping of fresh vegetables all will be well with me?

Stuart J. Ritchie,, Elliot M. Tucker-Drob, Simon R. Cox, Janie Corley, Dominika Dykiert, Paul Redmond, Alison Pattie, Adele M. Taylor, RuthSibbett, John M. Starr, Ian J. Deary

Predictors of ageing-related decline across multiple cognitive functions.

http://www.sciencedirect.com/science/article/pii/S0160289616302707


Ageing hedgehog plots

I call these “the hedgehogs”. They show that if you give every ageing person the same starting point then they age at different speeds. This gives us all hope. It may be delusional hope, but it is hope nonetheless. What makes some of us age gracefully?

It is critical to discover why some people's cognitive abilities age better than others'. We applied multivariate growth curve models to data from a narrow-age cohort measured on a multi-domain IQ measure at age 11 years and a comprehensive battery of thirteen measures of visuospatial, memory, crystallized, and processing speed abilities at ages 70, 73, and 76 years (n= 1091 at age 70). We found that 48% of the variance in change in performance on the thirteen cognitive measures was shared across all measures, an additional 26% was specific to the four ability domains, and 26% was test-specific. We tested the association of a wide variety ofsociodemographic, fitness, health, and genetic variables with each of these cognitive change factors. Models that simultaneously included all covariates accounted for appreciable proportions of variance in the cognitive change factors(e.g. approximately one third of the variance in general cognitive change). However,beyond physical fitness and possession of the APOEe4 allele, very few predictors were incrementally associated with cognitive change at statistically significant levels. The results highlight a small number of factors that predict differences in cognitive ageing, and underscore that correlates of cognitive level are not necessarily predictors of decline. Even larger samples will likely be required to identify additional variables with more modest associations with normal range heterogeneity in aging related cognitive declines.

The study has three waves of testing over six years (70 to 76 years of age), and a broad range of cognitive measures. It is also informed by the original measure of intelligence at age 11, so far better grounded than most research.

Here are the key findings:

Ageing and digit symbol

If you want a really good test of decrement of ability for the over 70s, use Digit Symbol substitution. Better than a brain scan any day.

About half of the drop in function across the 13 cognitive measures is shared. “It all goes together when it goes” is at least half true.

Brighter children become brighter, healthier, and fitter older adults. This ‘preserved differentiation’ appeared to last into the eighth decade of life.

The most robust and consistent predictor of cognitive change within old age, even after control for all the other variables, was the presence of the APOEe4 allele. APOEe4 carriers showed over half a standard deviation more general cognitive decline compared to non-carriers, with particularly pronounced decline in their Speed and numerically smaller, but still significant, declines in their verbal memory.

Women had significantly less general cognitive decline than men, mainly centered on Crystallized ability.

No evidence for a relation between education (or social class) and the slope of any of the cognitive factors.

The three fitness indicators weren’t much related to the rate of cognitive decline, but taken together there was a higher correlation, but nothing in this study to test the idea that improving physical functioning would have had a cognitive sparing effect.

If you don’t like the general drift of these results you may wish to say that age is a social construct, that the definition of old age is arbitrary, that countries differ considerably in their classifications of the elderly, that there is no precise point at which a person becomes old and that the whole concept is meaningless, or indeed totally meaningless. You could also argue that people have many abilities which have not been measured by the particular tests used in these studies, and that those untested abilities probably show no decrements. For example, tuneless whistling, stirring coffee while meditating, the recollection of things past, and smiling faintly at the last but one joke in a conversation. Each person shows their genius in their own way.

Back to the results. Perhaps a younger reader would be willing to take a quick look at all of them to make sure that I have understood them properly.

On reflection, I would ask the young reader that if this complex task takes you only a moment, please delay for a while before responding to me, so as not to make the contrast in our processing speeds too evident.

Friday 25 November 2016

Intelligence, emotions and personality


In my day, intelligence and personality required completely different lectures. Indeed, the subject areas did not overlap at all and each had a very different tone: intelligence involved intelligence tests, in which it was possible to do badly, which was certainly a disappointment to many in the class, and a source of much anti-IQ resentment.

Personality, on the other hand, was a bit less daunting, in that there were said to be no wrong answers. That wasn’t entirely true, but there were crumbs of comfort for almost everybody. It was implied that all personality types had their uses, “it takes all types to make a world” and that they would form a happy team if selected and organised properly.

Then some new ideas came up. The first and highly popular notion was that in addition to boring old analytic intelligence some people had an ability which really mattered: emotional intelligence. The term quickly became synonymous with a sensitive, perceptive, positive person, able to succeed in real life in ways that a sharper, colder, analytic mind would find difficult, if not impossible. The emotionally intelligent were intelligent about emotions: they could spot them and manage them, secret agents of the unconscious. The corporate world embraced the notion of EQ,  the Emotional Quotient they sought in their employees.

It took some time for those who had been actually researching the area to make the public understand that the popular term conflated two apparently different things: aspects of personality associated with success in life, and the ability to understand other people’s emotions. The first half was just plain old Personality. The second half was what the researchers were interested in: whether some people had a specific skill in understanding other people’s emotional states.

So, leaving aside personality, and looking only at the putative new emotional-state-understanding-skill,  they designed tests of emotional intelligence. This proved to be quite difficult. After a decade of work they found that there was some evidence for this skill, but to my reading no more outstanding than a minor subtest in a general intelligence test. Working out the emotions of others is related to general intelligence.

Meanwhile, over in the personality camp, not only had the field agreed that 5 main factors were a good resolution of the observed findings on the many proposed dimensions of personality, but some went further, and said that those five factors could be resolved into one general factor of personality. I like this idea, if only because I noted how much workplace gossip centred round complaining about uncooperative people, and the cooperative/uncooperative axis is an important aspect of the general factor of personality.

Now van der Linden et al. come along with a meta-analysis which seems to resolve the matter very neatly. They argue that the general factor of personality and emotional intelligence are one and the same thing.

van der Linden, D., Pekaar, K. A., Bakker, A. B., Schermer, J. A., Vernon, P. A., Dunkel, C. S., & Petrides, K. V. (2016, November 14). Overlap Between the General Factor of Personality and Emotional Intelligence: A Meta-Analysis. Psychological Bulletin. Advance online publication. http://dx.doi.org/10.1037/bul0000078

We examine the relationship between the general factor of personality (GFP) and emotional intelligence (EI) and specifically test the hypothesis that the GFP is a social effectiveness factor overlapping conceptually with EI. Presented is an extensive meta-analysis in which the associations between the GFP, extracted from the Big Five dimensions, with various EI measures is examined. Based on a total sample of k 142 data sources ( N 36,268) the 2 major findings from the meta-analysis were (a) a large overlap between the GFP and trait EI (r .85); and (b) a positive, but more moderate, correlation with ability EI (r .28). These findings show that high-GFP individuals score higher on trait and ability EI, supporting the notion that the GFP is a social effectiveness factor. The findings also suggest that the GFP is very similar, perhaps even synonymous, to trait EI.

https://www.researchgate.net/requests/attachment/26085345

general factor personality and emotional intelligence


Scoring high or low on the GFP would not necessarily indicate a good versus bad personality (Rushton & Irwing, 2011). Instead, it would mainly reflect the extent to which one uses emotional knowledge and skills in order to cooperate with others and obtain personal goals. Note that such knowledge and skills can, in principle, be used for ethical (e.g., maintaining friendships and working in teams) or unethical (e.g., deceiving and corrupting others) causes. Thus, similar to EI, the GFP can have a “bright” as well as a “dark” side.

In the fullness of time, instead of having to rely on theoretically fuzzy linear combinations of the Big Five factors, we will be able to utilize coherent constructs that have been specifically aligned to the core psychological processes underlying the emotional and social aspects of human behaviour.

k

This is interesting work, but there are some cautionary notes. No intelligence tests were given, so we cannot really say how much these personality aspects relate to real ability. Nor did they include measures of social desirability, also known as lying. Odd as it may seem, some respondents do not admit to having lousy personalities and appalling habits. In my view personality is best measured by observed behaviour, not questionnaire responses.

All those points apart, (which the authors put forward as limitations), they do not hide the fact that this is an elegant simplification of  some complicated constructs, and may indeed lead us to a more coherent understanding of emotional and social behaviour.

Wednesday 23 November 2016

Fourth Blog Birthday


Birthday candle


A blogger is a harmless drudge, a filter paper between a sack of coffee beans and a small expresso.

On the positive side, there is a sack of information to be read in the torrent of publications on intelligence. On the negative side, there is an even greater Sargasso Sea of mangled misunderstanding about human ability.

The torrent of publications would be unmanageable were it not for trusted researchers, many first met at ISIR conferences, who guide me to what they think of value, and at my request send me their own papers when they think they would suit the interests of Psychological Comments: interesting, new, and going faithfully in the direction of the evidence, not the preferred argument. I cannot always comment in detail on all of them, and in future I will try to at least mention those I have read even if I have not commented on them.

The Sargasso Sea of mangled misunderstanding I come across in newspapers and broadcast media never fails to irritate me. At times I feel I patrol the news, or at least that part of it which relates to human ability and life outcomes, on the lookout for egregious errors. The themes are repetitive: IQ does not exist; or cannot be measured; or can be measured much better by multiple intelligence, personal intelligence, emotional intelligence, rationality or motivation; can be boosted by a myriad of techniques including heroic training routines, more sleep and lunchtime naps, alertness drugs, and cunning new methods of instruction; and intelligence isn’t much use anyway, because achievement depends on motivation, luck, class, money, privilege; and finally, too much intelligence drives people nuts.

After all that provocation, it is with some surprise that I find myself still here, writing for those who bother to read essays, and who are interested to note how so many claims about intelligence fall apart if you bother the plod through the whole paper, and the appendixes. Thanks for being loyal readers.

To those who come across the blog, and then leave promptly in dismay at the Tables, Figures, Supplementary Appendixes and statistics: I am sorry your stay was so brief, but I do not blame you. Reading this blog will not boost your IQ nor the dimensions or performance of your private parts. It may, however, enlarge your understanding of intelligence research.

As per tradition, the blog birthday picture always shows one candle, so that we can acknowledge the triumph of survival undimmed by the metronome of mortality.

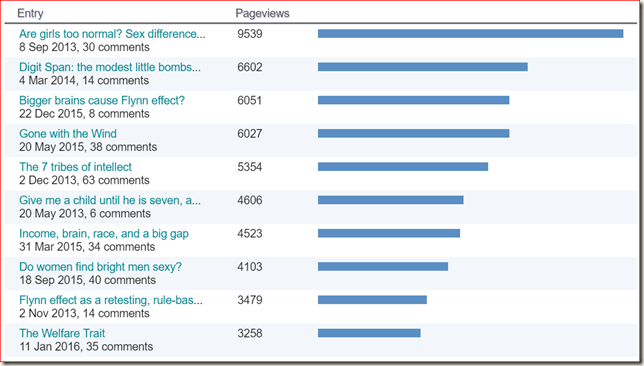
Here are are the top ten all time posts:

4th blog post totals

Most of these are old favourites which have first mover advantage. Good to see Digit Span rising so well.

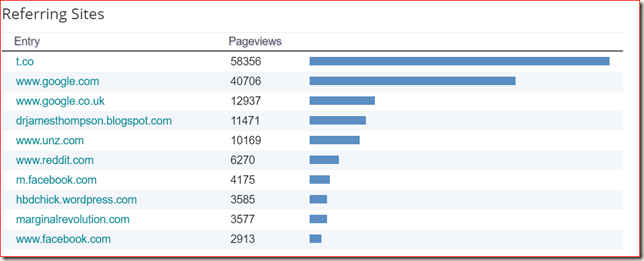
Top ten referring sites

4th blog referring sites

Twitter is the big leader, Google almost equal in size, but a respectable number of readers come straight to the blog. Thanks to Steve Sailer and others at Unz.com and HBDchick and others elsewhere for their support.

Top ten reader nations

4th blog countries

The US leads the way, 5 times more numerous than the UK in second place. Russia surprises me (Anatoly Karlin may have the explanation), also Ukraine.

Pageviews totals for 4th Blog Birthday


4th blog total pageviews


Last four years of total page views

               Pageviews     Twitter followers

Year 1           71,701              199

Year 2        313,753              597

Year 3        657,875              1,457

Year 4      1,o18,236          2,383


According to Klear, my tweets are seen by a “true reach”  average of 516 users (though individual “impressions” can be as high as 10,000). My followers are 30 years of age on average, 74% men, and 30% overall are considered influential.

Reflections

I have written 755 posts over these 4 years. I have achieved more readers than I imagined possible. Getting over a million page views is a big deal for me. I am sure that my blog has been read more in 4 years than my publications in 48 years. Indeed, because I published relatively little, I can be sure about it. If only blogging had been an option when I started out on my career, such as it was. However, lest I seem to be sneering at the Past, the  5 or 6 television programs I presented (usually 45 minutes long) were watched by one or two million viewers; the news interviews (usually 2 minutes long) could get audiences of five million, and the Chilean miners coming out one by one from their collapsed mine (one whole day in the BBC studio) got a good chunk of the reported one billion global audience. Old fashioned media are good at covering big events.

I digress. Back to blogging. I can still remember wondering if anyone would read my comments, and whether it was worth continuing. Even after a million page views it still feels as if I am whispering against a barrage of loudhailers.

Now over to you. Bring at least one person to read the blog, preferably a researcher, lecturer, teacher or student. Just one.

Thanks for reading.

Thursday 17 November 2016

Stereotypes about immigrant criminality


Writing a blog can be fun. Post something up one day, get someone writing in with a good tip about another subject for the next day.

The notion that immigrants are criminal has been described as a stereotype. As you know, a stereotype is a preliminary insight, the first step in noticing differences and encapsulating them into an association. Holding a stereotype about immigrants being criminals could be wrong and unfair. It could also be accurate and prudent.

How accurate are stereotypes about immigrants and crime? Here is a relevant paper from the United Kingdom.

Noah Carl. NET OPPOSITION TO IMMIGRANTS OF DIFFERENT NATIONALITIES CORRELATES STRONGLY WITH THEIR ARREST RATES IN THE UK. Open Quantitative Sociology and Political Science. 10th November, 2016

The author says: Public beliefs about immigrants and immigration are widely regarded as erroneous. For example, members of the public typically overestimate the immigrant fraction of the population by ~10–15 percentage points. On the other hand, popular stereotypes about the respective characteristics of different groups (e.g., sexes, races, nationalities) are generally found to be quite accurate.

The present study shows that, in the UK, net opposition to immigrants of different nationalities correlates strongly with the log of immigrant arrests rates (r= .77; p= 0.00002; 95% CI = [.52, .90]) and with the log of their arrest rates for violent crime (r= .77; p= 0.00001; 95% CI = [.52, .90]).

This is particularly noteworthy given that Britons reportedly think that an immigrant’s criminal history should be one of the most important characteristics when considering whether he or she should be allowed in to the country. Moreover, the associations are not accounted for by a general opposition to non-Whites, non-Westerners, foreigners who do not speak English, Muslims, or those from countries with low average IQ. While circumstantial in nature, the study’s findings suggest that public beliefs about immigrants are more accurate than is often assumed.

He adds: In Europe, immigrants from the West and East Asia tend to have lower crime rates, while those from the Middle East, Africa and South Asia tend to have higher crime rates (Kirkegaard, 2014; Kirkegaard, 2015). Note that this disparity is probably due to a combination of factors: relatively stable country-of-origin characteristics, the selectivity of immigrants with respect to their countries-of-origin, and perhaps differences in the treatment of immigrant groups upon arrival.

Crime figures from the Metropolitan Police for arrests 2008-2012 were used as the comparison.

Immigrant arrest rates London


Public beliefs about immigrants and immigration are widely regarded as erroneous. Yet popular stereotypes about the respective characteristics of different groups are generally found to be quite accurate. The present study has shown that, in the UK, net opposition to immigrants of different nationalities correlates strongly with the log of immigrant arrests rates and the log of their arrest rates for violent crime.

Indeed, they are consistent with a model of immigration preferences in which individuals’ expressed support or opposition to immigrants from different nationalities is informed by rational beliefs about the respective characteristics of those immigrant groups. The main limitation of this study is the lack of data on other characteristics of immigrant groups living in the UK, such as education, income or welfare usage (see Kirkegaard, 2014; Kirkegaard, 2015).

Read the whole paper here:

https://openpsych.net/files/papers/Carl_2016b.pdf

Wednesday 16 November 2016

The accuracy of stereotypes


immigrants in Denmark


Are immigrants more likely to claim benefits, or is this a stereotype?

A stereotype is a preliminary insight. A stereotype can be true, the first step in noticing differences. For conceptual economy, stereotypes encapsulate the characteristics most people have noticed. Not all heuristics are false.

Here is a relevant paper from Denmark.

Emil O. W. Kirkegaard and Julius Daugbjerg Bjerrekær. Country of origin and use of social benefits: A large, preregistered study of stereotype accuracy in Denmark. Open Differential Psychology.

https://www.researchgate.net/publication/309913792_Country_of_origin_and_use_of_social_benefits_A_large_preregistered_study_of_stereotype_accuracy_in_Denmark


This study is interesting, in that it was pre-registered, so its absence would have been noticed.  It compares stereotypes against actual data to get a test of accuracy. I was particularly struck by how the authors studied the answers at each wave of data collection, and tracked down those who gave perplexing answers, then refining their survey questions to reduce misunderstandings.

The paper also points out an unremarked aspect of stereotypes: they may be too weak. Stereotypes have to show a correlation with the facts, and be good predictors. You have to get the slope right, and also the intercept. It is not enough to have a vague notion that immigrants are on benefits, you ought to be able to estimate how many are on benefits.  A stronger stereotype would be a more accurate perception of reality.

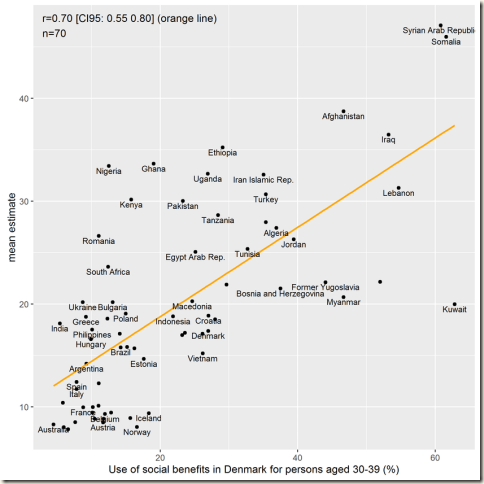
A nationally representative Danish sample was asked to estimate the percentage of persons aged 30-39 living in Denmark receiving social benefits for 70 countries of origin (N = 766). After extensive quality control procedures, a sample of 484 persons were available for analysis. Stereotypes were scored by accuracy by comparing the estimates values to values obtained from an official source. Individual stereotypes were found to be fairly accurate (median/mean correlation with criterion values = .48/.43), while the aggregate stereotype was found to be very accurate (r = .70). Both individual and aggregate-level stereotypes tended to underestimate the percentages of persons receiving social benefits and underestimate real group differences.
In bivariate analysis, stereotype correlational accuracy was found to be predicted by a variety of predictors at above chance levels, including conservatism (r = .13), nationalism (r = .11), some immigration critical beliefs/preferences, agreement with a few political parties, educational attainment (r = .20), being male (d = .19) and cognitive ability (r = .22). Agreement with most political parties, experience with ghettos, age, and policy positions on immigrant questions had little or no predictive validity.
In multivariate predictive analysis using LASSO regression, correlational accuracy was found to be predicted only by cognitive ability and educational attainment with even moderate level of reliability. In general, stereotype accuracy was not easy to predict, even using 24 predictors (k-fold cross-validated R2 = 4%).
We examined whether stereotype accuracy was related to the proportion of Muslims in the groups. Stereotypes were found to be less accurate for the groups with higher proportions of Muslims in that participants underestimated the percentages of persons receiving social benefits (mean estimation error for Muslim groups relative to overall elevation error = -8.09 %points).
The study was preregistered with most analyses being specified before data collection began


Figure-10-Mean-stereotype-and-real-values

The observed correlation of .7 is big, and useful. A majority of immigrants from Syria, Somalia and Kuwait are on benefits, as are those from Iraq and Lebanon. Even more to the point, if the benchmark is 25% for Danish citizens, then there are 19 countries with higher benefit rates. More positively, there are countries with lower rates, presumably because they are younger and employed. The data plot does not give us any guide to numbers from each country. However, later in the paper it is shown that immigrant population size is not relevant in judging benefit rates accurately.

The best predictor of having accurate stereotypes was cognitive ability (81% of simulations), followed by educational attainment (74% of simulations). Respondents underestimate the number of Muslims on benefits.

This is a very good paper. Data handling is exceptional, and well explained. There are lots of Figures and Tables. The sample is large and representative. The results have been looked at carefully, to identify those who participated without paying much attention to the questions. The data are available for re-analysis.

The high accuracy of aggregate stereotypes is confirmed. If anything, the stereotypes held by Danish people about immigrants underestimates those immigrants’ reliance on Danish benefits.


https://www.researchgate.net/publication/309913792_Country_of_origin_and_use_of_social_benefits_A_large_preregistered_study_of_stereotype_accuracy_in_Denmark

Saturday 12 November 2016

Losing vector directions


A few hours ago I posted up a commentary on a paper:

Brad Verhulst, Lindon J. Eaves, Peter K. Hatemi.  Correlation not Causation: The Relationship between Personality Traits and Political Ideologies. Am J Pol Sci. 2012; 56(1): 34–51.

https://www.ncbi.nlm.nih.gov/pmc/articles/PMC3809096/

Somewhat warily I added: I have scrabbled around for some guidance on this (personality and political attitudes) and came across a single paper to start the ball rolling. You find the meta-analysis on political attitudes and we are well on our way.

Sure enough, a single paper is an insufficient basis for a comment, particularly when the authors in an Erratum later admit that:

The interpretation of the coding of the political attitude items in the descriptive and preliminary analyses portion of the manuscript was exactly reversed. Thus, where we indicated that higher scores in Table 1 (page 40) reflect a more conservative response, they actually reflect a more liberal response.

http://onlinelibrary.wiley.com/doi/10.1111/ajps.12216/pdf

My thanks to reader LemmusLemmus.

I have written to the author of the Erratum to ask if the original miscoding was intended as a projective test for readers. I will await the response, but the paper, in that polite phrase, is “not suitable for hypothesis testing”, and in my view should be set aside.

A.E. Maxwell would have said “get to know your data before worrying about statistical tests”.


Losing an election


Losing an election is no fun. Hopes are dashed, and at least 4 years must pass (5 in the UK) before electors get a chance to vote the other lot out. Deferred gratification is a test of character.

It is natural for the losing side to feel incredulous when their side is defeated, particularly if opinion polls had given them false hope of victory. Since most people consort with like minded friends, they find that most of their social network  have the same political opinions. This makes the loss incredible, because their personal experience validates a firmly held view, and they are unaware that it is based on a very restricted sampling of opinion. A certain egocentric perspective is required to blot out the full range of human opinion so effectively. To resurrect a battered word, diversity of opinion is part of life, and the losing side must always recognize that.

Ever curious, I wonder if the Left are poorer losers than the Right. The null hypothesis, of course, is that a political loss hits both sides equally, and each lose equally badly, whatever their politics.

Is this true?

I have scrabbled around for some guidance on this, and came across a single paper to start the ball rolling. You find the meta-analysis on political attitudes and we are well on our way.

Brad Verhulst, Lindon J. Eaves, Peter K. HatemiCorrelation not Causation: The Relationship between Personality Traits and Political Ideologies. Am J Pol Sci. 2012; 56(1): 34–51.

https://www.ncbi.nlm.nih.gov/pmc/articles/PMC3809096/

The authors say:

The assumption in the personality and politics literature is that a person's personality motivates them to develop certain political attitudes later in life. This assumption is founded on the simple correlation between the two constructs and the observation that personality traits are genetically influenced and develop in infancy, whereas political preferences develop later in life. Work in psychology, behavioral genetics, and recently political science, however, has demonstrated that political preferences also develop in childhood and are equally influenced by genetic factors. These findings cast doubt on the assumed causal relationship between personality and politics. Here we test the causal relationship between personality traits and political attitudes using a direction of causation structural model on a genetically informative sample. The results suggest that personality traits do not cause people to develop political attitudes; rather, the correlation between the two is a function of an innate common underlying genetic factor.


Personality and political views

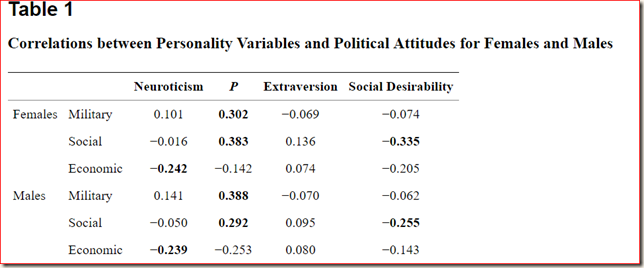
There are correlations between tough-mindedness (Psychoticism on the Eysenck personality inventory), social desirability (the Lie scale) and Neuroticism and political opinions on military, social and economic attitudes.

The authors say:

Higher P scores correlate with more conservative military attitudes and more socially conservative beliefs for both females and males. For males, the relationship between P and military attitudes (r = 0.388) is larger than the relationship between P and social attitudes (r = 0.292). Alternatively, for females, social attitudes correlate more highly with P (r = 0.383) than military attitudes (r = 0.302).

People higher in Neuroticism tend to be more economically liberal. That is, neurotic people are more likely to support public policies that provide aid to the economically disadvantaged (public housing, foreign aid, immigration, etc). Moreover, Neuroticism is unrelated to social ideology (rfemale = −0.016, rmale = −0.050). This finding suggests that neurotic individuals cope with their anxiety by supporting a “social safety net” or more “liberal” economic policies rather than “liberal” social policies.

They continue: There is also a substantively interesting relationship between Social Desirability and social ideology, which is larger for females (r females = −0.335; r males = −0.255). This facet of personality is highly context dependent, and therefore we can only speculate on this relationship, though our results are consistent with other conceptually similar findings. During the same time period in nationally representative samples, in several other attitude domains, liberal responses were also seen as more socially desirable (Kinder and Sears 1981). Thus, it appears that people who are motivated to present themselves in a socially desirable light also present themselves as socially liberal. This is only the second study we are aware of to explore the relationship between any ideological dimension and social desirability, yet the findings replicate the Verhulst, Hatemi, and Martin (2010) study on an Australian population.

So, the conventional explanation is that we have a personality difference which accounts for a political and behavioural difference. Tough-minded people are conservative in military and social matters, and would be expected to give less of a damn about ruffled feelings. Neurotic worriers want governments to help the disadvantaged, favour foreign aid, public housing and immigration. A proneness to worry may conceivably drive them to feel the pain of others, and to imagine they might one day be in need of such support themselves, so it may not all be altruistic.

Finally, those prone to Social Desirability effects (also known as the Lie Scale, a measure of “faking good”, or being incredibly naïve) are socially liberal.

On the basis of this finding, the loss of an election will be felt more strongly by the Left, mostly because they are tender minded, but also because they are worriers who feel that the poor of the world need help which will now be denied them, and that all of society should desire to be like them in their liberal attitudes (or their desire to be seen as liberal and generous).

From a tough-minded, emotionally stable perspective,  the great Democrat sadness, emotional upset and dismay is just the wailing of the mentally afflicted, wallowing in neurotic catastrophization and self-proclaiming virtue. Republicans see the Democrat response as infantile, the abject collapse of spoilt children who  cannot believe how nasty life has been to them.

From a tender-minded, emotionally sensitive perspective the Republican win is  just an extension of the insensitive, heartless and individualistic lack of concern they habitually show to anyone who gets in their way. Democrats see the Republican joy as demonic parents: violent, fascistic, dangerous; behaviours typical of oppressors who believe that life favours the brutal.

And so endeth the lesson.

However, the authors want more, so they do an ACE analysis, and conclude that a latent common genetic factor drives the development of both personality traits and political attitudes. This gives them their “Correlation not Causation” title, which in fact obscures their argument. They should have titled it “Do Personality Traits and Political Ideologies have a common genetic origin?”

For Extraversion, Neuroticism, and P the common environment is not significant in any of these variables.

The only personality trait that deviates from this trend is Social Desirability, characterized by large genetic and unique environmental variance components; however, there is also a significant, though more subtle, common environmental influence.

For political attitudes, the results are notably different. For the social and economic dimensions, the best-fitting model is the full model of additive genetic, common environmental, and unique environmental influences (ACE). There are sizable additive genetic components and substantial common environmental components to the attitudes, suggesting that individual differences in these attitude constructs are a mixture of genetic, shared, and unique environmental components. In contrast, military attitudes display a pattern of transmission similar to that of personality traits (AE), suggesting that attitudes toward the military are a function of what is learned through unique environmental (nonfamilial) influences and genetic transmission, more so than any common environmental influences.

The results so far suggest that the relationship between personality traits and political attitudes is more likely a function of a common set of genes shared between the personality traits and the political attitudes.

So, as the newspaper headlines would scream: “it’s genetic”. The poor weeping Democrats cannot be blamed for their maudlin display of petulance and tearful threats of exiling themselves to Canada. Nor, indeed, can the rich chortling Republicans be blamed for their heartless offensive comments and their eagerness in sending Mexicans back to their homeland.

Democrats are designed to take offence, Republicans to give it.

Finally, I can join all the other commentators and loftily opine: The Country is Split.

Wednesday 9 November 2016

Opinion palls


Last night I went to bed expecting a Clinton victory, because although opinion polls can be wrong, the margin of Democrat advantage exceeded the apparent margin of polling error. To further confirm my ineptitude at forecasting, I had also thought Remain would win over Leave in the Brexit referendum, for the same reason.

Today I reflect on some basic psychology, which is that attitudes do not translate directly into actions and, in a further complication, expressed attitudes differ from actual attitudes. This is particularly the case where the attitude is considered socially reprehensible, such as coveting one’s neighbours ox, or wife; being pleased when a rival fails to get a promotion; resenting a newcomer; or disliking someone because a superficial characteristic grates on your nerves.

Of course, I have always known, but often forgotten, that there is a gap between what is thought and said, and a bigger gap between what is said and done.

I also know, but often forget, that public opinion polls habitually use smaller samples than required for proper representativeness,  and that the pollsters then “correct” their raw results using a set of assumptions gained from trying to correct previous errors (turnout rate, for example) whilst also looking over their shoulders at what most other polls are saying, so as to not be the odd one out. Come to think of it, the pollsters’ fascination with finding out what other people are thinking infests the poll companies themselves, and they are guided by what other poll companies are thinking. Polls of polls simply aggregate and confirm the group errors.

Will attention continue to be paid to opinion polls, given their inability to spot what the public really intend to do? The growing awareness that polls are used to influence opinion as much as to measure it has become painfully obvious. They are not trustworthy, and flourish most when people cannot work out their own opinions for themselves. No, I do not want to ban them. I just want to get out of my habit of paying them much attention.

Now, here is a quick check of the predictions I made yesterday against Edison Research exit questionnaires:

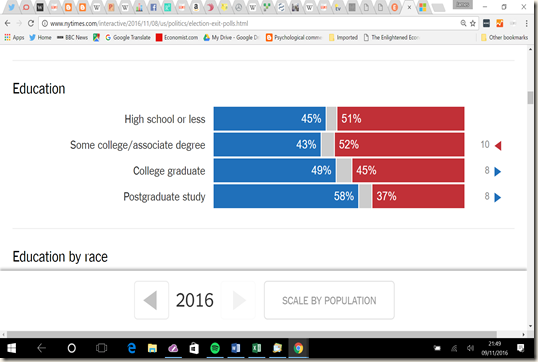
Most of all I wonder how years of education, which supposedly indicates an ability to evaluate arguments, will correlate with actual votes, and thereby to test the popular supposition that the better educated voters will shun the Republican candidate. I assume that sex and age will have a minor influence, but the latter might show bigger differences, with older voters more cynical and more likely to vote Republican. Race should not matter at all, because if America is a melting pot then policies not polities should prevail. If races vote en bloc (say more than 65% in one direction) then the woe betide the republic, which will become disunited genetic states.

Years of education

image


Post-graduates voted Democrat, as expected. However, I did not consider income:

image

There was some effect of low income boosting Democrat votes, but those with income above $50,000 were not swayed by necessity, and voted according to political preferences. Perhaps the well-educated post graduates took the sorts of degrees which did not boost their income. Psychology, anyone?

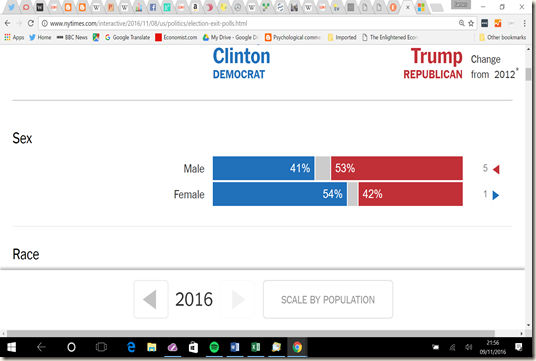
Here are the sex differences:

image

In fact, much bigger than I imagined would be the case.

image

The age differences were also bigger, though I got it half right, in that older voters were more likely to vote Republican than those younger than 45, and particular than those younger than 30.

As regards race, you will see that I put forward a null hypothesis I did not believe in, but wanted to test. I used to follow the majority in describing the US as a melting pot, but have come to think of it as only a dispersal ground.

image

Black voters are overwhelmingly Democrat, and can be considered a bloc vote. Hispanic/Latinos and Asian also meet precisely my predicted bench mark of 65% to be considered bloc voters. The “other” voters look as if they have been somewhat considering the actual policies, as do the White voters, but both are not that far off the 65% boundary I plucked out of the air as an indicator of race-based voting. Blacks to an extraordinary degree, and Hispanics and Asians to a large degree jumped left, Whites jumped right.

So, is the summary of this election “it’s race, stupid”? If so, I also predicted a Disunited Genetic States. I doubt it. Governments habitually do less than they promise, and have less influence than they imagine. The great flywheel of habit usually reigns supreme.  Usually.  I will consider this matter further after a good night’s sleep.

Tuesday 8 November 2016

The country is split: Post-election traumatic reactions


Whilst the US election is still being decided, I have jumped the gun over all other commentators, and got my wise post-election explanations in first.

After every election commentators aver that “the country is split” and then explain how a massive fault line runs between the winners and the losers. This is interesting, but it is not clear how any election could be conducted without the country being split, because even a large majority vote would reveal that the smaller number of losers were split off from the winning majority. It is precisely because people are not all of one mind that elections are held, in order to find out which view is supported by the majority.

The next delusion, particularly when one party’s vote is very similar to the other party, is that the voters all collaborated in not giving either party a majority. That is to say, that there was a version of the Parliamentary pairing procedure whereby one Member of Parliament agrees with another Member from the opposite party that both will not attend a debate and will not vote, and will instead go to attend to other matters, commonly a mistress. (If it turns out to be the same mistress, I presume the arrangement breaks down somewhat).

In the case of a finely balanced election result, this type of pairing arrangement, commentators pronounce, has percolated through to the general public, who have decided that neither party deserves unfettered access to power. Perhaps. However, how does an equal vote by telepathic balancing compare to the simpler case of two sides virulently disagreeing with each other, but being unable to muster enough votes to crush the other side? Sometime the country is split, and has very different views as to which policies are required. The parsimonious explanation is that neither side was able to gain advantage, despite their best efforts. Balancing with the other dreadful lot was the last thing on anyone’s mind.

So, the results of the election always have the same underlying features: voters chose which party to support for their own idiosyncratic ends, and the commentators explain their supposed deep reasons after the event. That does not mean that I turn my eyes away from those sub-group analyses beloved of political specialists. What will I be interested in seeing after the US election?

Most of all I wonder how years of education, which supposedly indicates an ability to evaluate arguments, will correlate with actual votes, and thereby to test the popular supposition that the better educated voters will shun the Republican candidate. I assume that sex and age will have a minor influence, but the latter might show bigger differences, with older voters more cynical and more likely to vote Republican. Race should not matter at all, because if America is a melting pot then policies not polities should prevail. It races vote en bloc (say more than 65% in one direction) then the woe betide the republic, which will become disunited genetic states.

Yes, I know that years married will probably be the best predictor, as Steve Sailer has shown, with the longest married being the most Republican, the one night stands most Democrat, but I was saving that for last.

Does the US have a mechanism for doing the whole thing again and again, a Hanging Chad constitutional loophole which iterates a bootstrapping procedure to overcome the poverty of historicism?

Just asking.

Monday 7 November 2016

Advice to persons about to elect a government


every vote counts


Some people think it is not worth voting because their individual vote is insignificant when compared to the total electorate. For example, the total US electorate is estimated to be 226 million, against which most individuals would consider themselves to be insignificant. The basis of that particular argument is what I call the metric shift illusion:

The “metric shift” illusion is a common ploy, particularly when someone has an axe to grind. “If everyone were to switch off just one light bulb, we could close a power station”. (Marvellous, but how many power stations are there? A small reduction in power consumption will lead to a small reduction in power generation, and not a kilowatt more than that). “Just one penny of tax will raise X million of money for good causes”. (Bless, but removing an additional penny from each pound of income will take a large amount of earnings from every citizen, and they probably regard their own choices as better than bureaucrats’ choices). “An enormous number of citizens are diagnosed every year with Horrible Disorder X”. (My sincere commiserations, but either give me the total numbers for all other disorders, or just give me the rate per 100,000 so I can put all disorders in all nations onto a common metric. Also, “diagnosed” is not equivalent to “about to die from”).

The metric shift illusion obscures the fact that voters in an election have just as much influence in that activity as they do in any other activity: switching off lights; giving up meat; selling their car in favour of a bicycle, picking up litter; being courteous to strangers; not making noise at night, shooting stray dogs. In both the election of governments and the election of activities they can exert influence at a national level. Really, each individual should compare the influence they have when they exert themselves against the smaller amount of influence they have when they do not. Seen in that light, citizens can attempt to boost their influence both electorally and behaviourally by talking to others about the reasons for their choices, and encouraging others to act like them. (That is a minority pursuit, probably restricted to about 4% of the population). Even then, activists on one side tend to cancel out activists on the other side, but one side wins out over the other often enough to encourage further activism, if only out of a thirst for revenge.

Of course, in an reductio ad absurdum, if everyone believed that it was not worth voting, no one would vote. Therefore, those who fail to understand the consequences, and thus do not vote, disenfranchise themselves on the basis of a misunderstanding. Possibly that boosts the average IQ of the remaining voters, but it most certainly boosts their influence on national affairs.

At this stage you might imagine that I am about to encourage US citizens to vote. Not really. Voting should be voluntary, and whether you want to vote or not is up to you. One proviso: if you don’t vote, don’t bemoan the governments you get.

Ever the contrarian, there is an argument that large scale national decisions have less impact on the average citizen than very local issues. The location of noxious factory or busy road, the management of local schools and hospitals, the probity and efficacy of the local Police force, the quality of mercy of your neighbours: all these may be far more impactful on your life than international conferences and the machinations of national legislators. Therefore, you might wish to be most active in local matters, and always vote in local elections, and always agitate for the changes which which concern you and your back yard. Let the big distant problems remain distant.

I pause for a moment to consider this notion. Nope, it doesn’t work. If a nation votes for open borders then your locality will face issues which are not of your own making. Equally, if your nation votes for or against free trade that will impact you more than a noisy local road, irritating as that may be.  Oh dear. Perhaps it would be best for you to vote after all, not that I would wish to impose anything on you, though if you don’t vote, that which will be imposed upon you will be done so without your consent or, more accurately, with your tacit approval.

Up to you. You could stay home and read de Tocqueville. Let me know when the whole thing is over.

Thursday 3 November 2016

Election Special: Are Republicans brighter than Democrats?


trumpclintonaa

As you know, I don’t do policy,  but I am aware that there is an election happening in the US, and it is a particular feature of this election that each side is accusing the other side of being very stupid. You may feel that one side does it more than another, but that is one of the features of taking sides. No surprise about this polarization: the preferences of others can be bewildering, and stupidity is a plausible cause of the odd choices other people make.

As a general rule, democratic choices will tend to reflect the average mental ability of electors, who have to work out which party is best for them and for their country (which equates to what is best for them in the long run). This requires them to understand what is being offered, determine how sensible those offers are, and how likely they are to be delivered. This is usually a difficult process, ideally requiring a detailed examination of policy positions, a careful study of what might happen as a consequence of the projected changes, and an evaluation of each party’s track record in implementing new laws. These are complex matters, requiring high ability and persistence. Thinking that hard about how to vote is probably a minority interest. Talking of minorities, in a representative democracy one hopes that the elected might be brighter than the average elector. Hopes. The intelligence level of the elected leadership is an important matter, as well as their probity.

https://drjamesthompson.blogspot.co.uk/2015/09/the-intelligence-of-governments.html

The method for determining the intellectual ability of electors of different parties should be simple: find a dataset which contains mental ability measures and political allegiance classifications, and see what the scores look like for each political party.

However, not all researchers are in favour of simple approaches. They seem to find them crude, misleading, and even vulgar. So, in addition to tussles between Democrats and Republicans we have a battle between the research parties of Descriptive Statistics and Corrected Confections. I make no pretence of neutrality on this issue: I think researchers should start with Descriptive Statistics, and then give justifications at each stage as they apply each putative “correction”. This allows us to make our own choices about each correction: is it justified, and worth applying, or are important issues being smoothed away?

Noah Carl (2014) found that Republicans were brighter than Democrats by 2-3 IQ points, and that a Republican advantage held true even when allowance was made for socio-economic status. The IQ difference was largest for committed supporters of each party. Sample sizes were large in his study, and the mean differences sufficient to have real life consequences.

Republicans brighter

Note that among committed supporters Republicans are 5 IQ points ahead on Vocabulary and 3 IQ points ahead on probability, verbal reasoning and comprehension. Brighter, in fact. Assume for the purposes of argument that Democrats are IQ 99 and Republicans IQ 102 thus reflecting the observed 3 point difference which I will take as a summary of the results. Then at IQ 130 (+2 sigma, or elite university level equivalent) we will find 1.9% of Democrats and 3.1% of Republicans. Highest paying jobs will mostly be obtained by Republicans. At +1 sigma, corresponding to white collar jobs, we will find 14.3% of Democrats and 19.3% of Republicans. Finally, if we consider an IQ of 93 to be required for most reasonable jobs, then 34.5% of Democrats will be rejected, and only 27.4% of Republicans. Differences of a mere 3 IQ points on average become more evident at the extremes, and can inflame political discussions. Democrats will be slightly more likely to feel aggrieved about job opportunities and status than Republicans.

Here is the link to the Noah Carl (2014b) paper:

https://drive.google.com/file/d/0B3c4TxciNeJZdWRRTVMzN0lWa0U/view?usp=sharing

What does Yoav Ganzach (2016) find?

Cognitive ability and party identity: No important differences between Democrats and Republicans.  Intelligence 58 (2016) 18-21

Here is the link to the Yoav Ganzach paper:

https://drive.google.com/file/d/0B3c4TxciNeJZV0l5dVRrS0czUEU/view?usp=sharing

Unfortunately, I cannot give a simple account of what he finds, because I cannot find a table in Ganzach’s paper which plainly compares the raw scores for Republicans and Democrats as done by Noah Carl above. Table 1 could have given the raw results, but instead gives correlations, and this obscures a plain understanding of the IQ differences between the parties.

Republican intelligence correlations

The intellectual measures are positively correlated with White and negatively correlated with Black. Instead of means there are many tables of regressions once the “controls” have been activated. Here is Ganzach’s argument:

The zero order correlations between our measures of cognitive abilities and our measures of republican identification are significantly positive for three of our four measures of cognitive ability (p< 0.0001), indicating that without controlling for SES and race, the cognitive abilities scores are higher for those who identify as republicans than for those who identify as democrats. However, when SES and race are controlled these differences disappear and even reverse.

Ganzach argues that Carl should have done an additional correction for race, and that when that alteration is made then the Republican advantage is not present. Of course, another interpretation, as Ganzach is well aware and discusses at the end of his paper, is that he reveals the Republican advantage only to make it disappear by assuming that Black Democrats can be controlled away. If that is done, one can show that White Democrats are as bright as White Republicans. This is in line with previous findings: you can be on the Left because you are clever, or because you seek a compensation payment.

https://drjamesthompson.blogspot.co.uk/2014/10/are-lefties-clever-or-just-grasping.html

I find it tiresome when researchers repeat the Sociologists Fallacy that it is right to “correct” for social class, as if people were allocated to occupations randomly in an experimental model. Not so. Brighter and more diligent persons tend to get better occupations, and to try to wash that away with a regression loading (a penalty for education and income) is to ignore reality. (In this case the SES measures used were years of education and income).

Similarly with race. If more Black Americans vote Democrat, thus lowering the average intelligence levels for that party, that is a fact of political life. Sure, it would be interesting to look at the intelligence of white Republicans and white Democrats, but it does not deny the facts on the ground when the question is whether Republicans are brighter than Democrats as a whole.

The author concludes: The two studies presented in this paper suggest that once SES and race are controlled for, there is a very little difference between Democrats and Republicans in cognitive ability.

He adds:

Could it be argued that controlling for race and SES obscures the real relationship between cognitive ability and party identity, and that the effects of race and SES on party identity are really effects of cognitive ability? This argument is not in line with the view that to demonstrate convincingly that between-groups differences in an ability test are associated with between-groups differences in GMA, it is also necessary to demonstrate that between-individuals differences within each of the groups are associated with between-individuals differences in GMA (Jensen, 1998; Jensen & Figueroa, 1975). This is not the case for party identity since although between-groups differences in party identity are associated with between-groups differences in cognitive ability, within each of the groups party identity is not associated with cognitive ability.

Comment: I find this difficult to follow. Party identity is not an achievement score, and does not have as much range as mental ability, so correlations are restricted in range. More to the point, we do not have to prove anything. We just observe that one group is brighter than another because of the intellectual level of the people they attract.

Within the context of the current study, cognitive ability may have three important associations with party identity. It is associated with party identity because (1) people who come from higher SES strata tend to score higher on cognitive ability tests as well as to identify more with the Republican party; (2) Blacks tend to score lower on cognitive ability tests as well as to identify more with the Democratic party; and (3) the level of cognitive processing associated with identifying as a Democrat is different from the level of cognitive processing associated with identifying as a Republican. Thus, although Republicans may very well score higher in cognitive ability tests, this effect is, in our view, of little interest since it could be explained by SES and by ethnic differences in test scores. The question of real interest is whether there are differences in the level of cognitive processing necessary for adopting a Democrat vs. Republican identity, or, roughly speaking, whether is it more intelligent to be a Republican than to be a Democrat.

Comment: I do not know if there are different mental processes involved in joining different parties. The parsimonious model would be that people join the parties which reflect their values and their needs. Black Americans probably feel that the Democratic party is closer to their causes and offers them more, and that is enough for any voter. The crunch comes in the penultimate sentence above: although Republicans may very well score higher in cognitive ability tests, this effect is, in our view, of little interest since it could be explained by SES and by ethnic differences in test scores. I disagree that it can be “explained” because there is an equally strong explanation that brighter people become Republicans because they understand that Republican economic and social policies are better in the long run. The American Dream and so on. As part of this intelligence-based explanation, any less bright group will be less likely to understand those benefits. (This is easily testable, by looking at the voting preferences of all minorities ranked by intellect. How do the Chinese, Japanese, Vietnamese people in the US vote: Democrat or Republican? Which way do Mexicans incline? Democrat or Republican?)

As our results indicate, the answer to this question is negative.

Comment: In fact positive, before corrections render the difference “unimportant”.

Finally, we note that the issue of applying appropriate controls is a fundamental issue in intelligence research. Many studies in the intelligence literature adopt a conservative approach, and assess the effect of intelligence only after controlling for basic background variables such as race and SES. Other studies, including recent studies about the relationships between intelligence and political attitudes (Carl, 2015; Solon, 2014), assess the effect on intelligence without partialing out the effects of background variables. It is still an open question whether the results of these recent studies hold when control for such variables is exerted.

Comment: how can a contentious “correction” take precedence over the simple results? Surely one should have the simple description first, and the controlled version second? We should start by being impartial, and then by exploratory degrees consider the arguments for adjusting the findings, justifying each use of partialing out of presumed confounders.

It is a pity that one can read the entire paper without finding means and standard deviations (remember those?) for the ability measures by race and by social class. That would allow readers, by comparing the results with those derived from other samples, to judge whether they are in the right ball park with other research. Why obscure the most important data when you are writing a paper about cognitive ability? The paper says: “no important differences”. Well, where are the differences in plain text so that we can judge for ourselves?

Now to the upcoming US election. I am aware that intelligence is only one ingredient in voting behaviour, and that deep emotions are stirred by politics, leading to tribal loyalty and blind allegiance to all manner of absurdities. However,  to my mind the question, shorn of adjustments, is answered thus: Republicans are brighter than Democrats. So, it follows that we intelligence researchers must predict that Republicans will make the  best choice, the one most soundly based on an appreciation of reality, and will make the most accurate prediction as to what would be best for America. The implication is that Republicans will make better choices. That is the theory, and I stand by it, in the sense of backing it only until better data becomes available and it is proven wrong.

However, if Republicans are truly brighter than average there will probably be fewer of them than Democrats, just as a feature of the bell curve, so they will lose the election, since all votes count equally and are not “corrected” for intelligence.

Do let me know how the whole US election thing turns out. On reflection, let me know 4 years from now. No sense in rushing to judgment on these important matters.

To quote my Twitter self: Hard to say which is worse: the party you vote for fails to get in, or the party you vote for gets in and fails you.